American Airlines Group inc Share Price 2025 to 2035:- American Airlines Group Inc (NASDAQ: AAL) is a deeply cyclical airline with a large (but falling) debt load, a valuable loyalty program, and meaningful fleet upgrades coming late-decade. That cocktail makes the stock a high-beta play on travel demand, fuel costs, and execution
What moves American Airlines Group Inc stock
- Demand & fares: Leisure vs. corporate mix, international vs. domestic pricing, ancillary revenue.
- Fuel & costs: Jet fuel volatility and labor contracts drive margins.
- Debt & rates: Deleveraging and refinancing terms can change equity value quickly.
- Loyalty economics: AAdvantage is a cash-generating machine that stabilizes the business through cycles.
- Fleet & network: Newer, more efficient aircraft (plus premium-seat growth) can lift unit revenue. American Airlines Group
Where AAL stands today (context for 2025–2026)
- Debt is still heavy, but improving. As of Q2 2025, American reported ~$38B total debt and ~$29B net debt, the lowest net figure since 2015, after repaying a convertible note. American AirlinesThe Motley Fool
- Record revenue, wobbly outlook. Q2 2025 revenue hit a record (~$14.4B) and adjusted EPS beat, but the company warned of a possible Q3 loss and cut full-year 2025 guidance—reminding investors how fast sentiment can swing. Yahoo FinanceMarketWatch
- Labor & operations remain in focus. Flight-attendant negotiations and overall reliability (especially through severe weather) are watch items for costs and brand. ReutersMarketWatch
- Fleet renewal is finally showing up. American expects Airbus A321XLR long-range narrowbodies and is executing a large single-aisle refresh to expand premium seats—both positive for margins over time. Simple FlyingAP News
- Loyalty is an under-appreciated asset. Third-party appraisals and management commentary have historically valued AAdvantage in the high-teens to low-30s billions—underscoring a durable cash engine even in tough cycles. Aviation StrategyTravel Data Daily
Baseline reality: AAL is a levered, improving balance-sheet story tied to demand and execution. The upside can be big; the drawdowns can be painful. American Airlines Group
Price drivers through 2035
1) Demand mix and pricing power
- International long-haul and premium cabins typically price better than domestic economy; A321XLRs can open new, thinner long-haul routes with better yields.
- Corporate travel normalization is a late-cycle tailwind; a slowdown would hit domestic fares first.
2) Unit costs, fuel, and labor
- Jet fuel is the wild card; sustained lower fuel supports multiple expansion.
- New and renegotiated labor contracts raise fixed costs but can stabilize operations—reliability sells seats.
3) Balance sheet & interest rates
- Net-debt reduction and refinancing at lower coupons (if rates fall) could shift more enterprise value to equity holders.
- Covenants and capex for fleet deliveries matter: big order books mean multi-year capital needs. AP News
4) Loyalty monetization
- Bank co-brands and miles sales smooth cash flow; tighter program management can lift margins even if fares soften. Aviation Strategy
5) Execution and reliability
- Weather disruptions, supply-chain hiccups (engines/parts), or delays in cabin retrofits can dent near-term RASM and costs.
Valuation framework (how these targets are built)
To keep things transparent, here are the anchors behind the ranges: American Airlines Group
- Normalized EPS assumptions (rounded):
- Bear: $0.80–$1.20 (high costs, weak fares).
- Base: $1.80–$2.60 (steady demand, moderate fuel, some deleveraging).
- Bull: $3.00–$3.60 (firm pricing, efficient ops, lower fuel, material deleveraging).
- Multiples: Airlines often trade 7–12× forward EPS in “normal” conditions; deleveraging and loyalty quality can support the high end, while recessions compress to the low end.
- Share count: Assumes no large new equity issuance. (Refinancing risk is real, but management has been paying down debt.) American Airlines
These are probabilistic ranges, not guarantees.
American Airlines Group Inc share price targets (2025–2035)
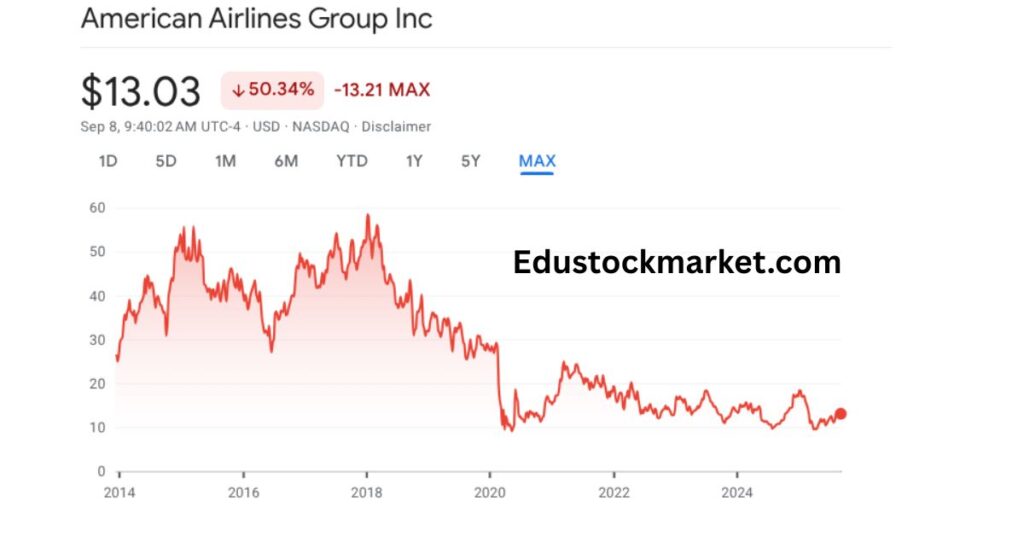
Ranges are year-end targets in USD, by scenario. Current price reference (Sep 8, 2025): ~$13.08.
| Year | Bear | Base | Bull |
|---|---|---|---|
| 2025 | 8–11 | 12–16 | 16–20 |
| 2026 | 7–10 | 13–18 | 18–24 |
| 2027 | 7–11 | 14–20 | 20–27 |
| 2028 | 6–10 | 15–22 | 22–30 |
| 2029 | 6–10 | 16–24 | 24–33 |
| 2030 | 6–11 | 18–26 | 26–36 |
| 2031 | 6–12 | 19–28 | 28–38 |
| 2032 | 6–13 | 20–29 | 30–40 |
| 2033 | 6–14 | 21–31 | 32–42 |
| 2034 | 6–15 | 22–33 | 34–44 |
| 2035 | 6–16 | 23–35 | 36–46 |
How to read this table:
- In a bear world (recession, sticky fuel, cost pressure), the stock could revisit single digits and grind sideways.
- In a base world (steady demand, manageable fuel, gradual deleveraging), low- to mid-20s by decade-end is plausible.
- In a bull world (premium growth, stronger international, softer fuel, clear deleveraging), $35–$45 by 2035 is within reach. American Airlines Group
Why these ranges are reasonable
- Debt trajectory: Management has guided to continued deleveraging; lower net debt reduces equity risk and can support higher P/E over time. American Airlines
- Capacity & product mix: The A321XLR and ongoing retrofits aim to raise premium seating and unit revenue; execution would expand margins in outer years. AP NewsSimple Flying
- Loyalty economics: AAdvantage’s historic valuations and cash flows provide ballast even when fares wobble—helpful for downside protection and refinancing. Aviation Strategy
- Cyclicality reminder: The Q3-loss warning, despite record revenue, highlights how quickly the narrative can flip—hence the wide near-term bands. MarketWatch
Key risks (and how they could break the thesis)
- Macro downturn: Business travel retrenchment and price-sensitive leisure demand can compress yields quickly.
- Fuel spike: A sharp, sustained rise in jet fuel erodes margins and typically compresses multiples.
- Labor cost creep: Higher base pay and profit-sharing without productivity gains hurt CASM ex-fuel; unresolved negotiations can weigh on operations. Reuters
- Supply-chain snags: Engine issues, parts shortages, or certification delays (e.g., cabin installations for new types) can delay capacity and raise costs. Simple Flying
- Balance-sheet risk: If cash flow underperforms, debt reduction stalls—limiting equity upside and raising refinancing risk. American Airlines American Airlines Group
Catalysts to watch
- Quarterly guidance vs. delivery: Revenue per available seat mile (RASM), CASM-ex-fuel, and free cash flow. American Airlines
- Net-debt milestones: Watch for progress below key round numbers (e.g., toward <$25B net by late-decade). American Airlines
- Premium seat growth: Updates on A321neo/XLR roll-ins and retrofits, plus corporate recovery commentary. AP News
- Loyalty co-brand deals: Renewals or expanded bank partnerships can lift high-margin cash flow. Aviation Strategy American Airlines Group
Practical game plan (if you’re tracking the stock)
- Pick your scenario: Decide whether your base case is mid-cycle recovery (base), persistent headwinds (bear), or clean runway into 2027+ (bull).
- Use checkpoints: Re-rate your view every two quarters on three numbers—RASM, CASM-ex-fuel, and net debt.
- Respect the cycle: Consider scaling entries/exits around fuel spikes, seasonal lulls, or guidance resets.
- Remember the asset: American Airlines Group Inc is not a steady compounder; it’s a trader’s airline until deleveraging is clearly done.
FAQ
Is American Airlines Group Inc undervalued today?
At ~$13, AAL prices in plenty of fear on costs and growth. If net debt continues to fall and premium capacity ramps, the base-case path to high-teens/low-20s by 2029–2031 is reasonable. If guidance keeps slipping, the bear case dominates. MarketWatch
What could push AAL into the bull range?
- Lower fuel, 2) visible deleveraging progress, 3) smoother operations and productive labor deals, and 4) stronger international yields as A321XLRs open profitable routes. Simple Flying
How important is AAdvantage to the stock?
Very. Loyalty programs have been valued in the tens of billions and generate steady, high-margin cash flow via bank partners—key when fares soften. Aviation Strategy
Does the 260-plane order mean dilution?
Not directly. It does mean multi-year capex and a need for consistent cash generation and financing. Execution and balance-sheet progress will determine equity outcomes. AP News
Conclusion
American Airlines Group Inc is a classic high-operating-leverage story. In the near term (2025–2026), guidance volatility and macro jitters justify conservative ranges. Through the late 2020s and into the early 2030s, premium seating growth, loyalty monetization, and deleveraging are the levers that can carry AAL into the mid-20s (base) or $35–$45 (bull) by 2035.
Investing in airlines is never risk-free. But if American executes on network, product, and balance sheet—while avoiding major fuel or operations shocks—the next decade could reward patience. Treat position sizing with respect, track the checkpoints, and keep your scenario map handy.